Graphics Debugging in Visual Studio 2013
Visual Studio 2013 has a built-in graphics debugger that can capture a rendered frame. This is a replacement for PIX.
To use it with Chromium:
- Pass the command arguments: --no-sandbox --in-process-gpu
- To enable gpu rasterization, include the command line arguments: --force-gpu-rasterization --enable-impl-side-painting
- You might need following hack or something diff --git a/content/app/content_main_runner.cc b/content/app/content_main_runner.cc index 05e45bd..46db961 100644 --- a/content/app/content_main_runner.cc +++ b/content/app/content_main_runner.cc @@ -401,6 +401,11 @@ int RunNamedProcessTypeMain( { switches::kGpuProcess, GpuMain }, #endif // !CHROME_MULTIPLE_DLL_BROWSER }; + base::CommandLine& command_line = + *base::CommandLine::ForCurrentProcess(); + command_line.AppendSwitch(switches::kInProcessGPU); + command_line.AppendSwitch(switches::kNoSandbox);
- Within Visual Studio, show the Graphics toolbar
- Click File>Open>Project/Solution, and then click your chrome.exe FYI, release build chrome.exe/content_shell.exe works well.
- Click the "Start Diagnostics" button on the Graphics toolbar
- While hardware accelerated graphics are being rendered within Chromium, press the Print Scrn key, or the "Capture Next Rendered Frame" button on the Graphics toolbar
Each frame time will be super imposed on top of Chrome. If you don't see this then the Graphics Debugger is not working correctly and you won't be able to capture frames.
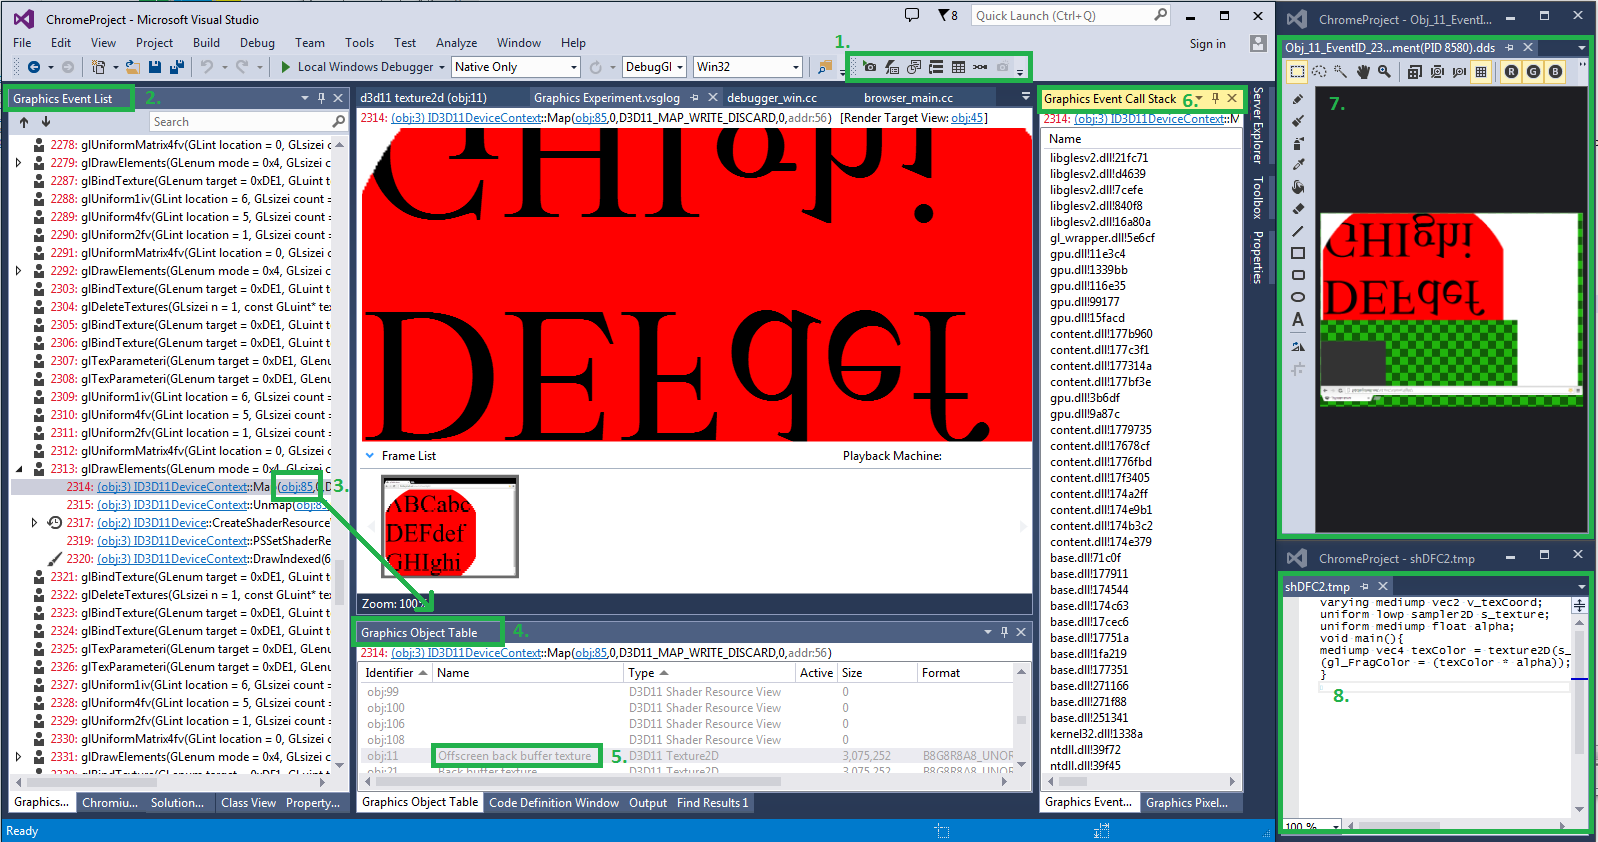
Here is a description of some of the more important elements of the Graphic Debugger (numbers correspond to the highlighted part on the above image):
- The Graphic toolbar
- The Graphic Event List pane keeps a complete history of the calls to create the frame. Clicking through the list will generate a preview of the frame up to the call that you have selected in the .vsglog frame in the center.
- Within the event list, you can find objects that were created by or used in a function call
- The Graphics Object Table contains a list of all objects used during the frame
- The name of an object is set within the chrome source. For example, if you search for "Offscreen back buffer texture", you will find it in the function "SwapChain11::resetOffscreenTexture"
- Some calls within the Graphics Event List will give you a call stack (usually, you must click directly on a DirectX function to get a call stack)
- If you double click an object in the Graphics Object Table, you can get details on the object. If it is a texture, it will open and display the texture
- If you double click on a shader in the Graphics Object Table, you can open a temporary file that shows the shader code
You can find more information on the Graphics Debugger at http://msdn.microsoft.com/en-us/library/hh873207.aspx and https://www.youtube.com/watch?v=j4SpasLF6Co
You may find it useful to use the configuration manager within Visual Studio to create multiple debug targets. For example, you can set up a second configuration to pass the gpu specific flags.