Recording Tracing Runs
When diagnosing performance problems it can be valuable to see what Chrome is doing "under the hood." One way to get a more detailed view into what's going on is to use the about:tracing tool.
See Trace Event Profiling Tool (about:tracing) for more information on what this tool does.
Capture a trace on Chrome desktop
Sometimes Chromium developers will ask for about:tracing results in a bug report to help us understand what's going on. Here's an easy step-by-step guide: Submitting an Awesome Performance Bug
The TL;DR:
- Open a new tab and type "about:tracing" in the Omnibox.
- Press "Record". Choose the "Manually select settings" preset, click the All button above the left column and press "Record".
- Switch back to the tab with the content you're debugging and do whatever it is that's slower than it should be (or behaving incorrectly). A few seconds of the bad activity is usually sufficient.
- Switch back to the tracing tab and press "Stop", then "Save"
- (Optional) If this is for a bug report, upload the output file as an attachment to bug. If the file is bigger than 10MB, zip it first (the files compress well, and files bigger than 10MB can be truncated during upload).
IMPORTANT: Before attaching a trace to a bug keep in mind that it will contain the URL and Title of all open tabs, URLs of subresources used by each tab, extension IDs, hardware identifying details, and other similar information that you may not want to make public.
Capturing chrome desktop startup
Assuming $CHROME is set to the command you need on your OS to start chrome, the following will record the first 7 seconds of Chrome's lifetime into /tmp/foo.json
$CHROME --trace-startup --trace-startup-file=/tmp/foo.json --trace-startup-duration=7
On Windows you can modify the properties for your Chrome shortcut to add this after where it says chrome.exe (don't forget to modify it back when you are done):
--trace-startup --trace-startup-file=%temp%\foo.json --trace-startup-duration=7
Capture a trace from Chrome on Android (on device)
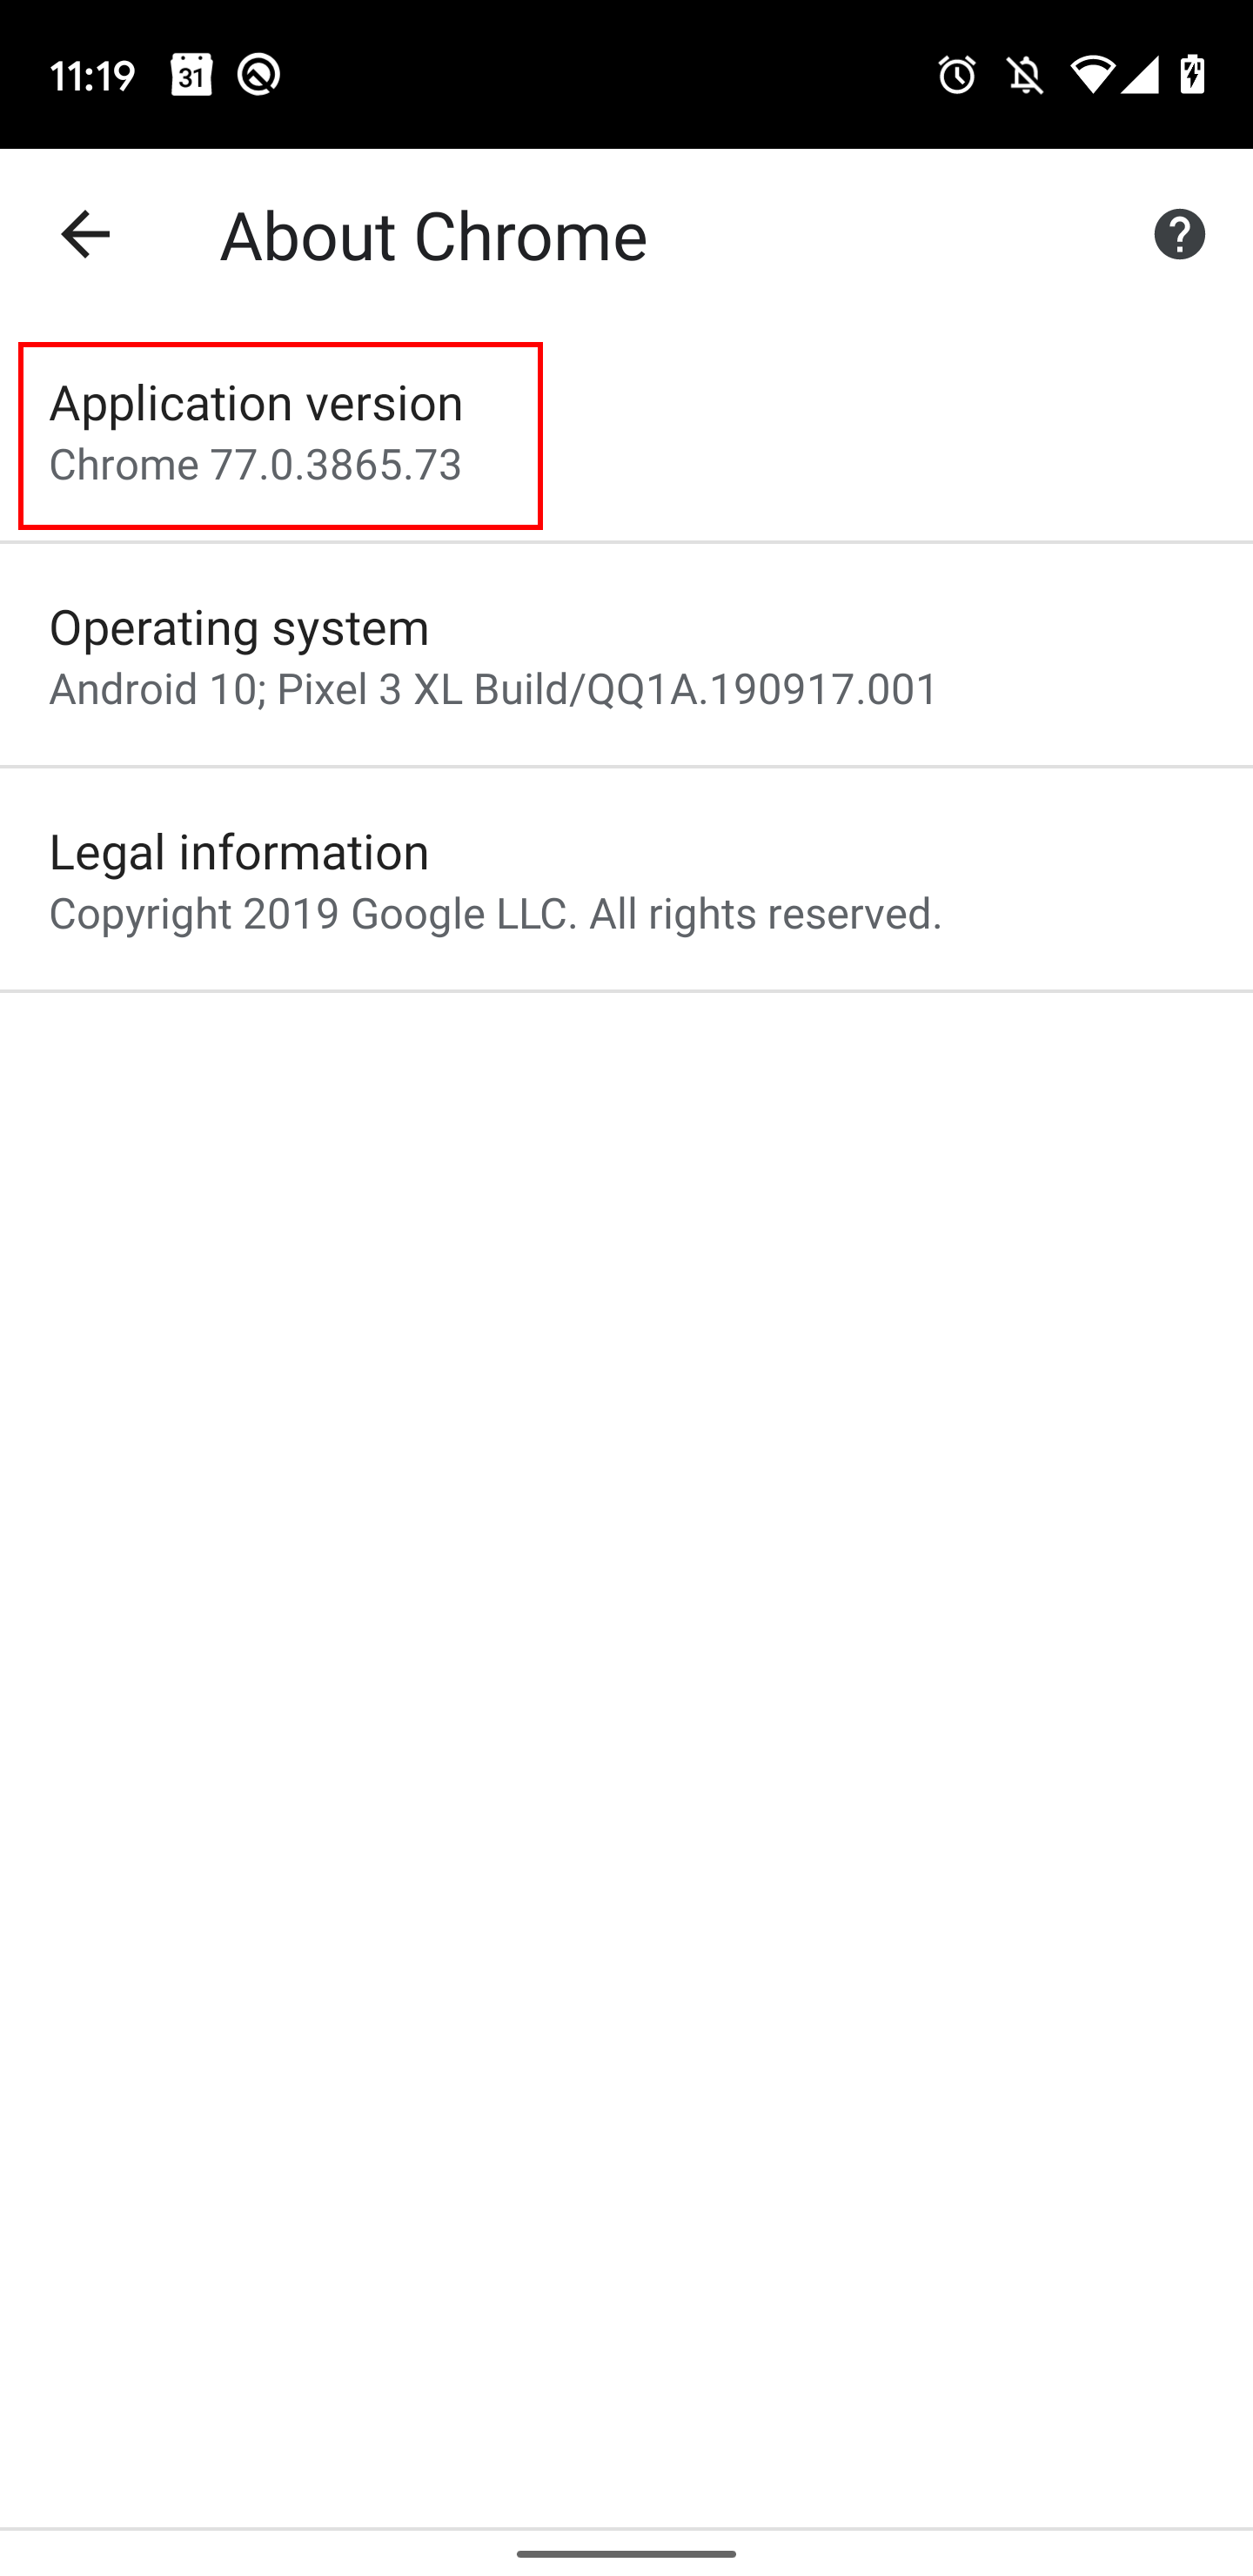
First you need to enable Chrome's developer options. To do this, open Settings > About Chrome. Then tap "Application version" 7 times in a row:
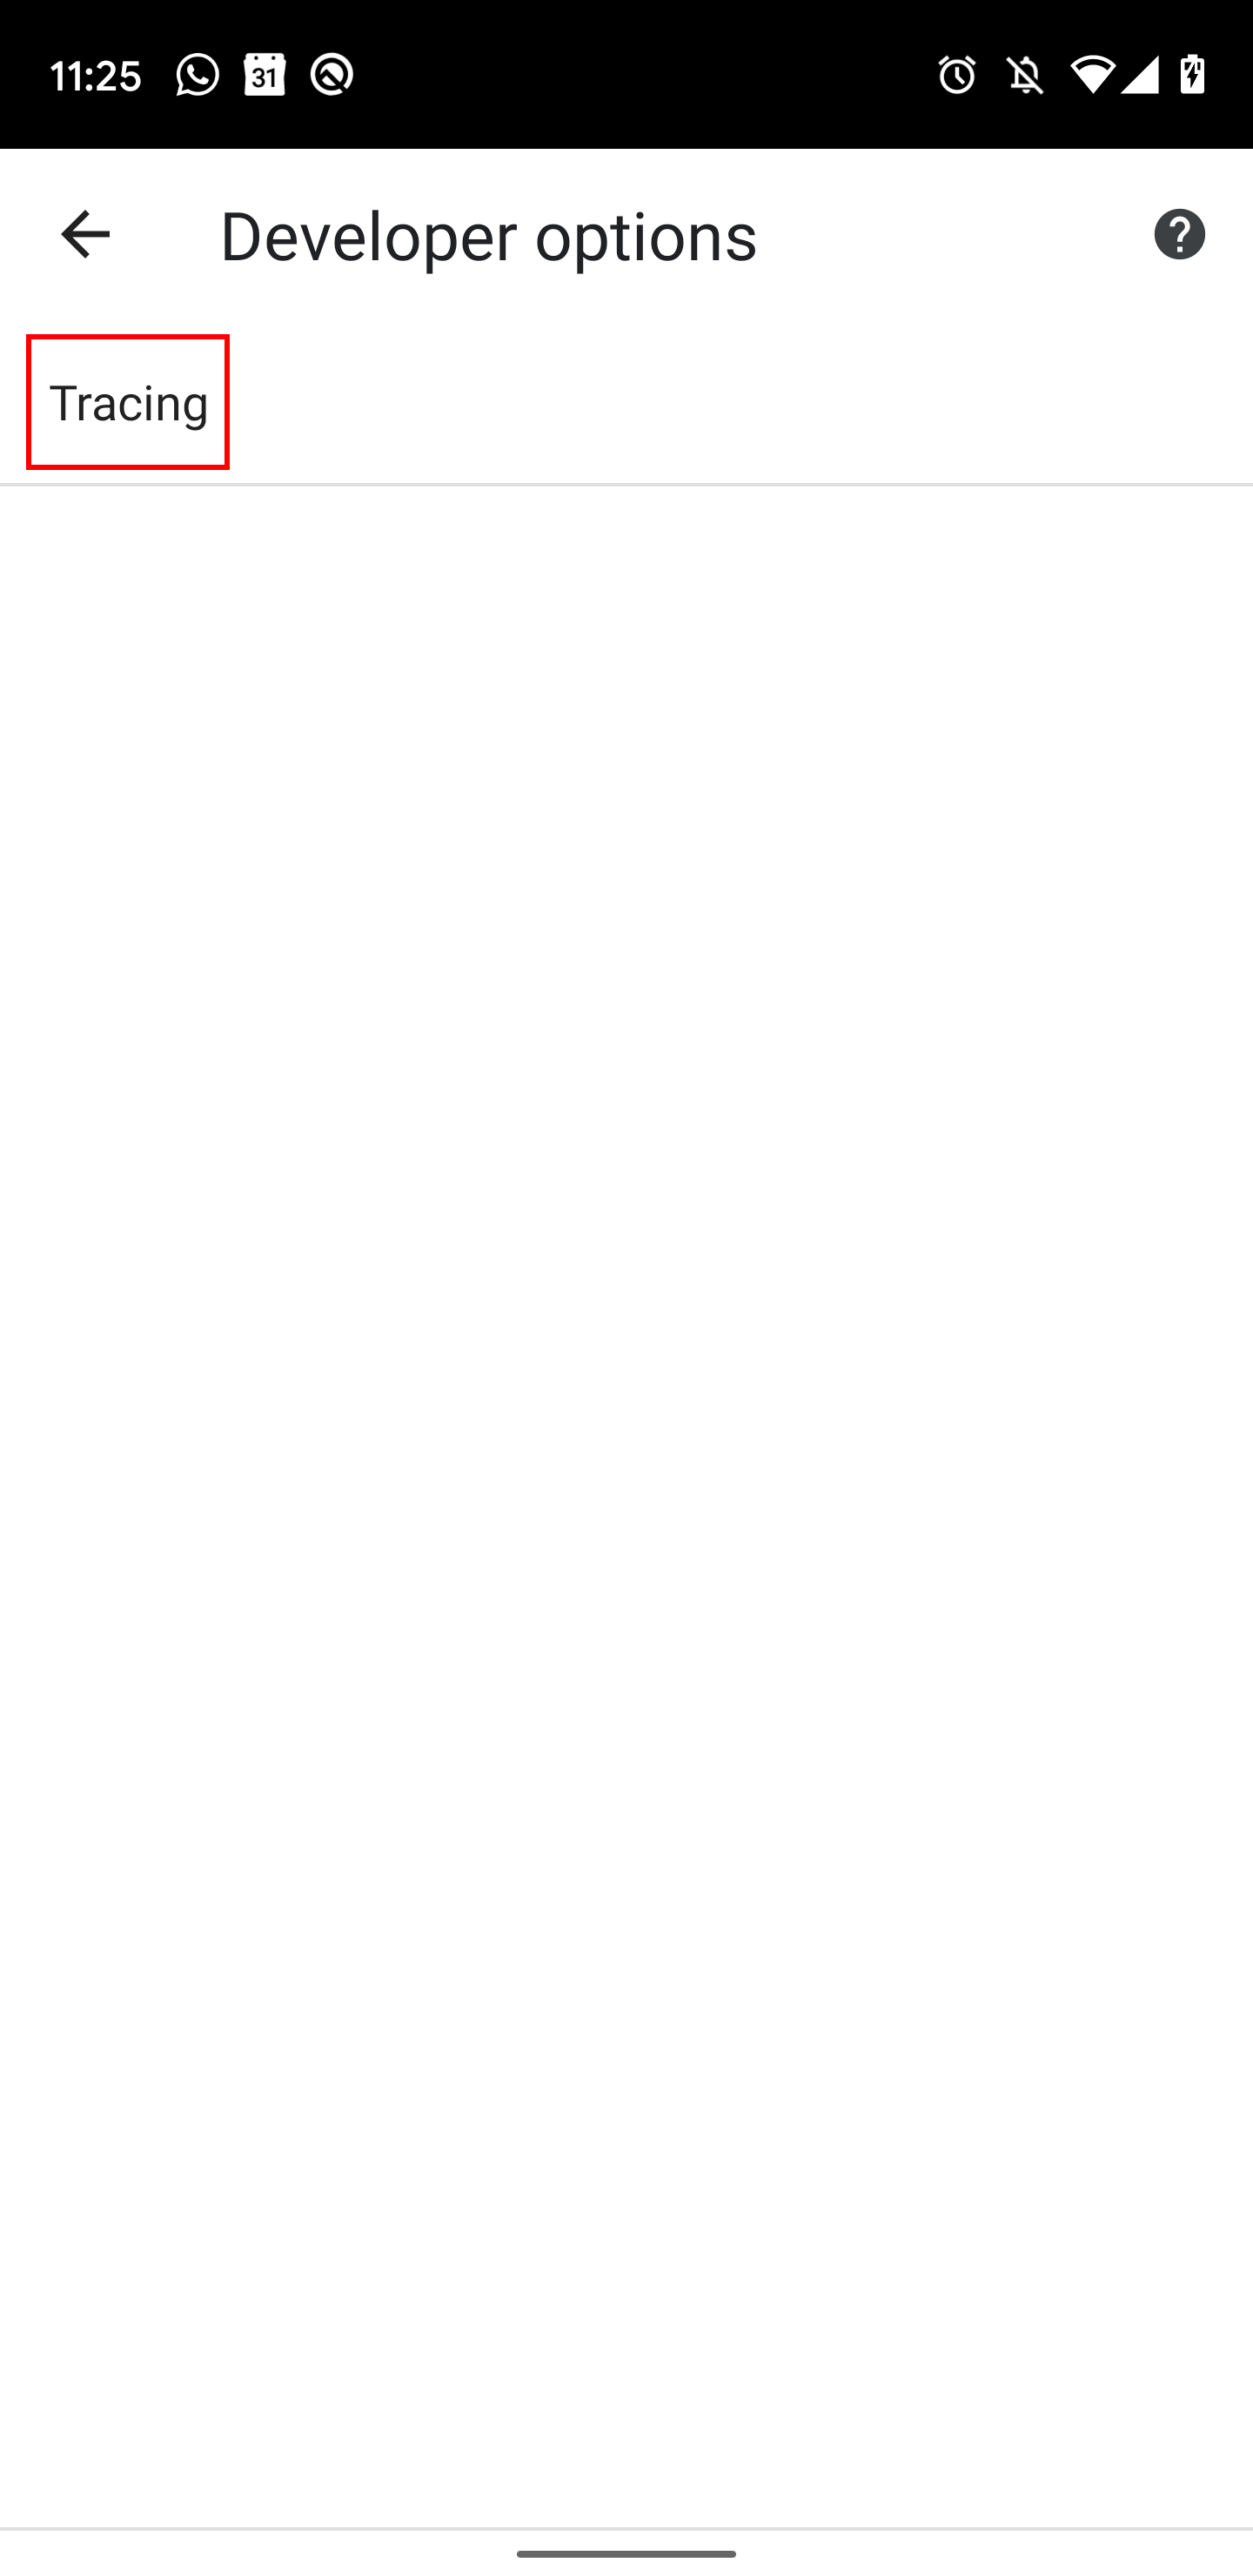
After this you can access developer settings from Settings > Developer options. From this menu, select Tracing:
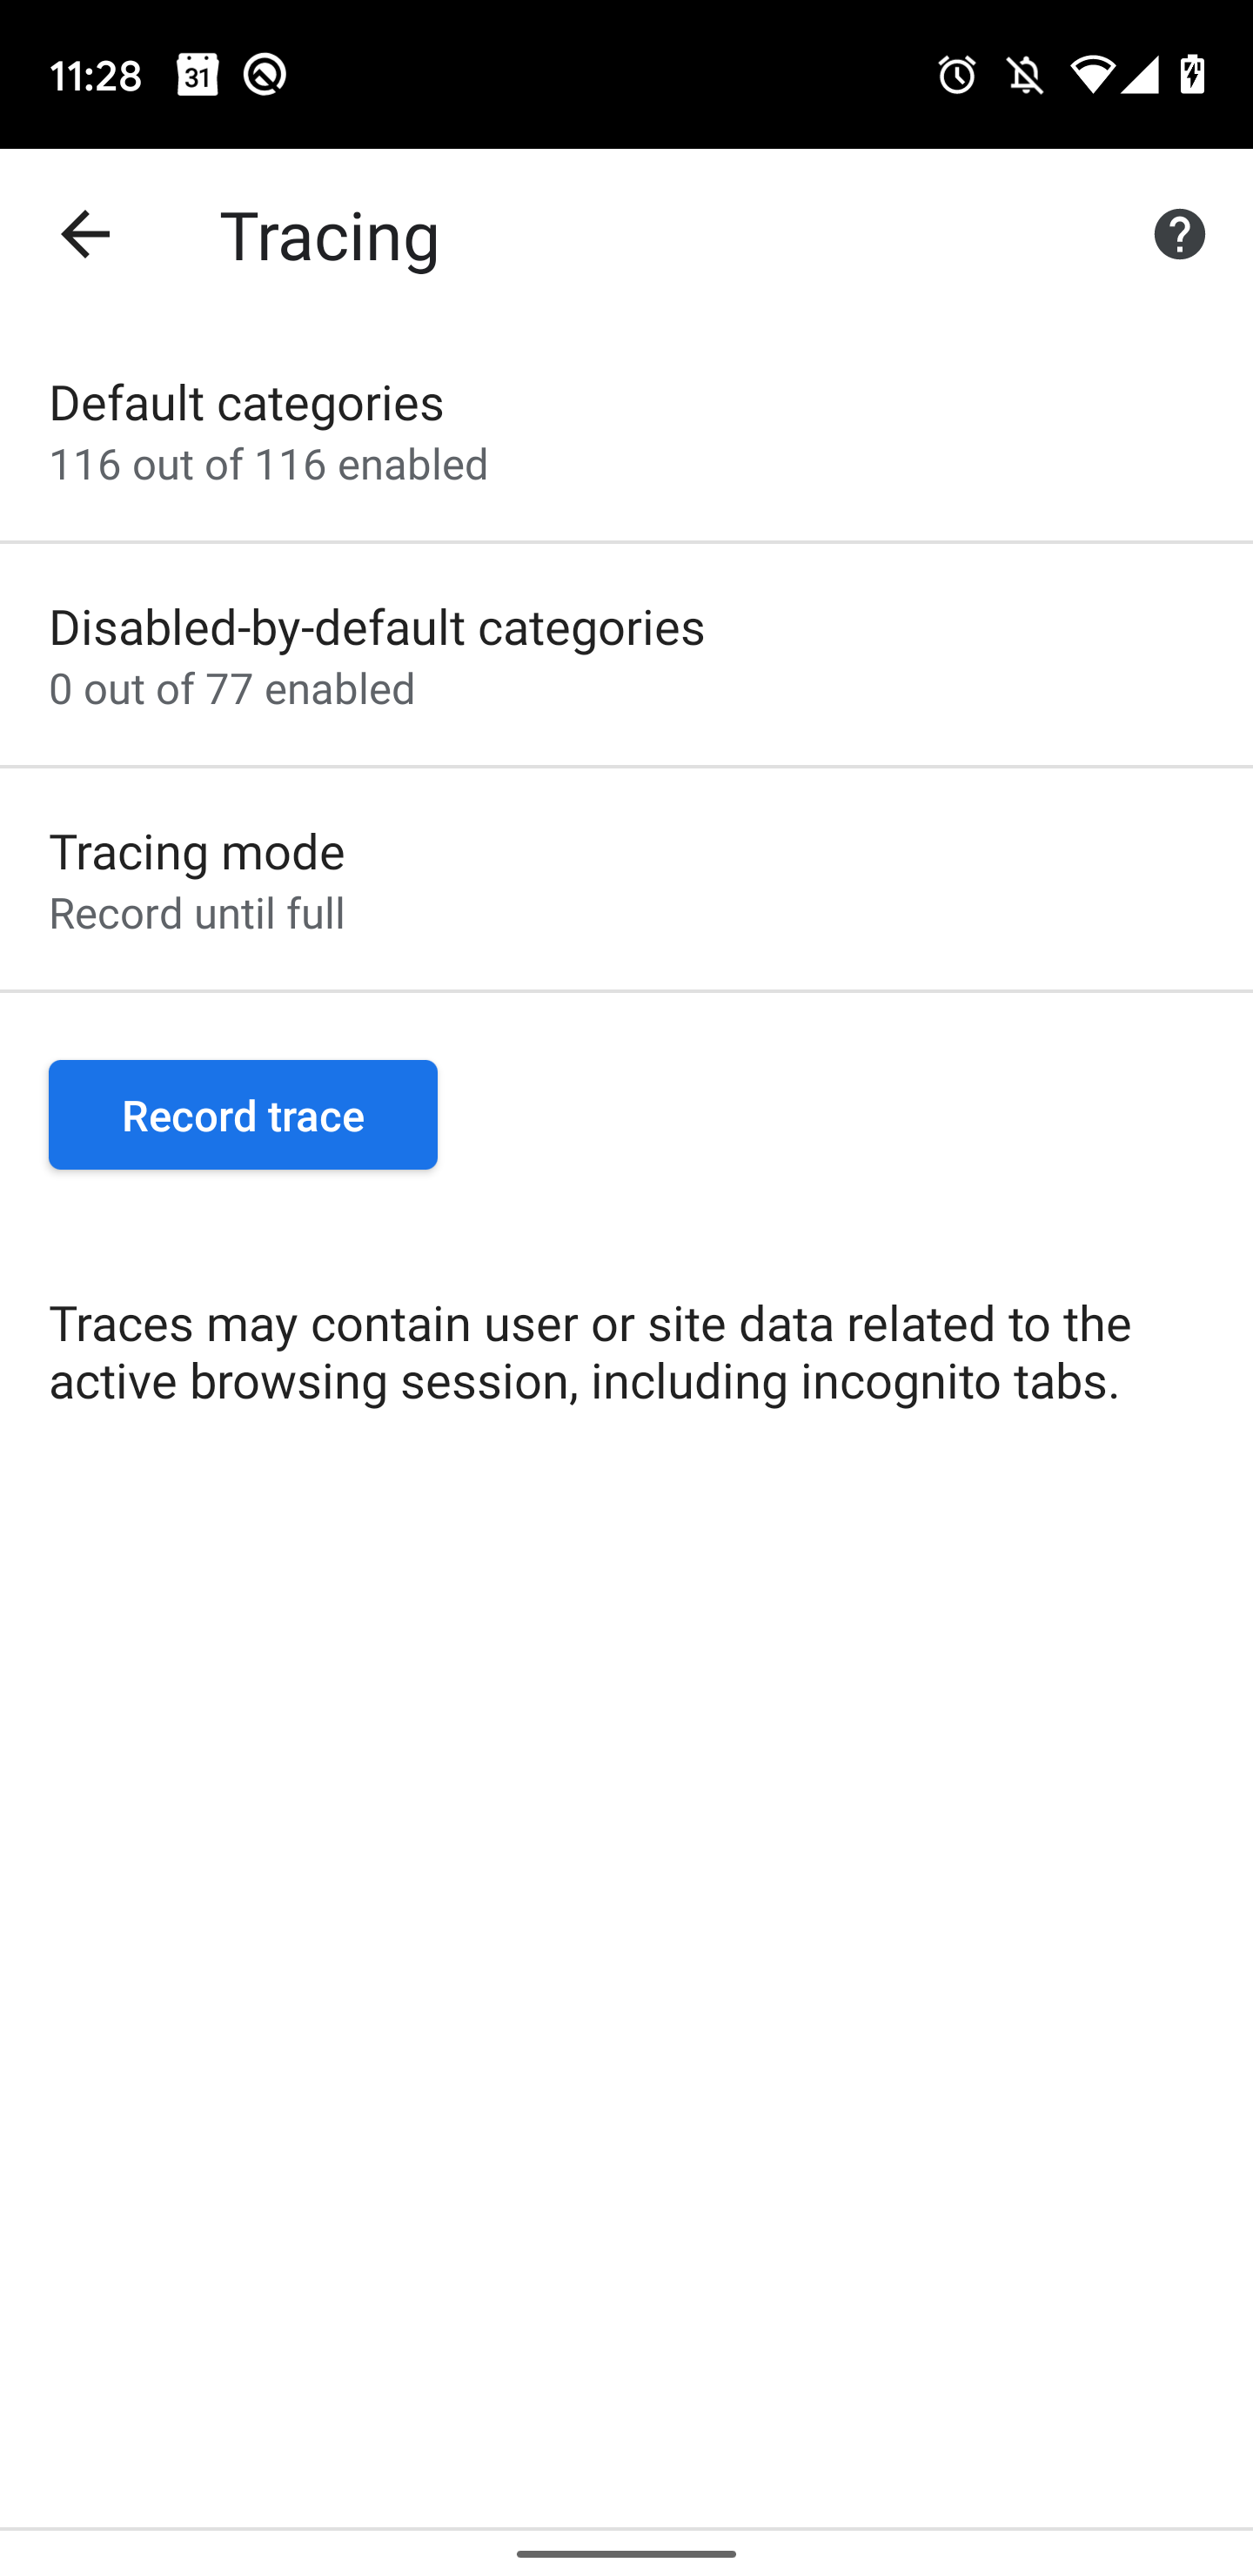
Select your categories and tap "Record trace" to start recording:
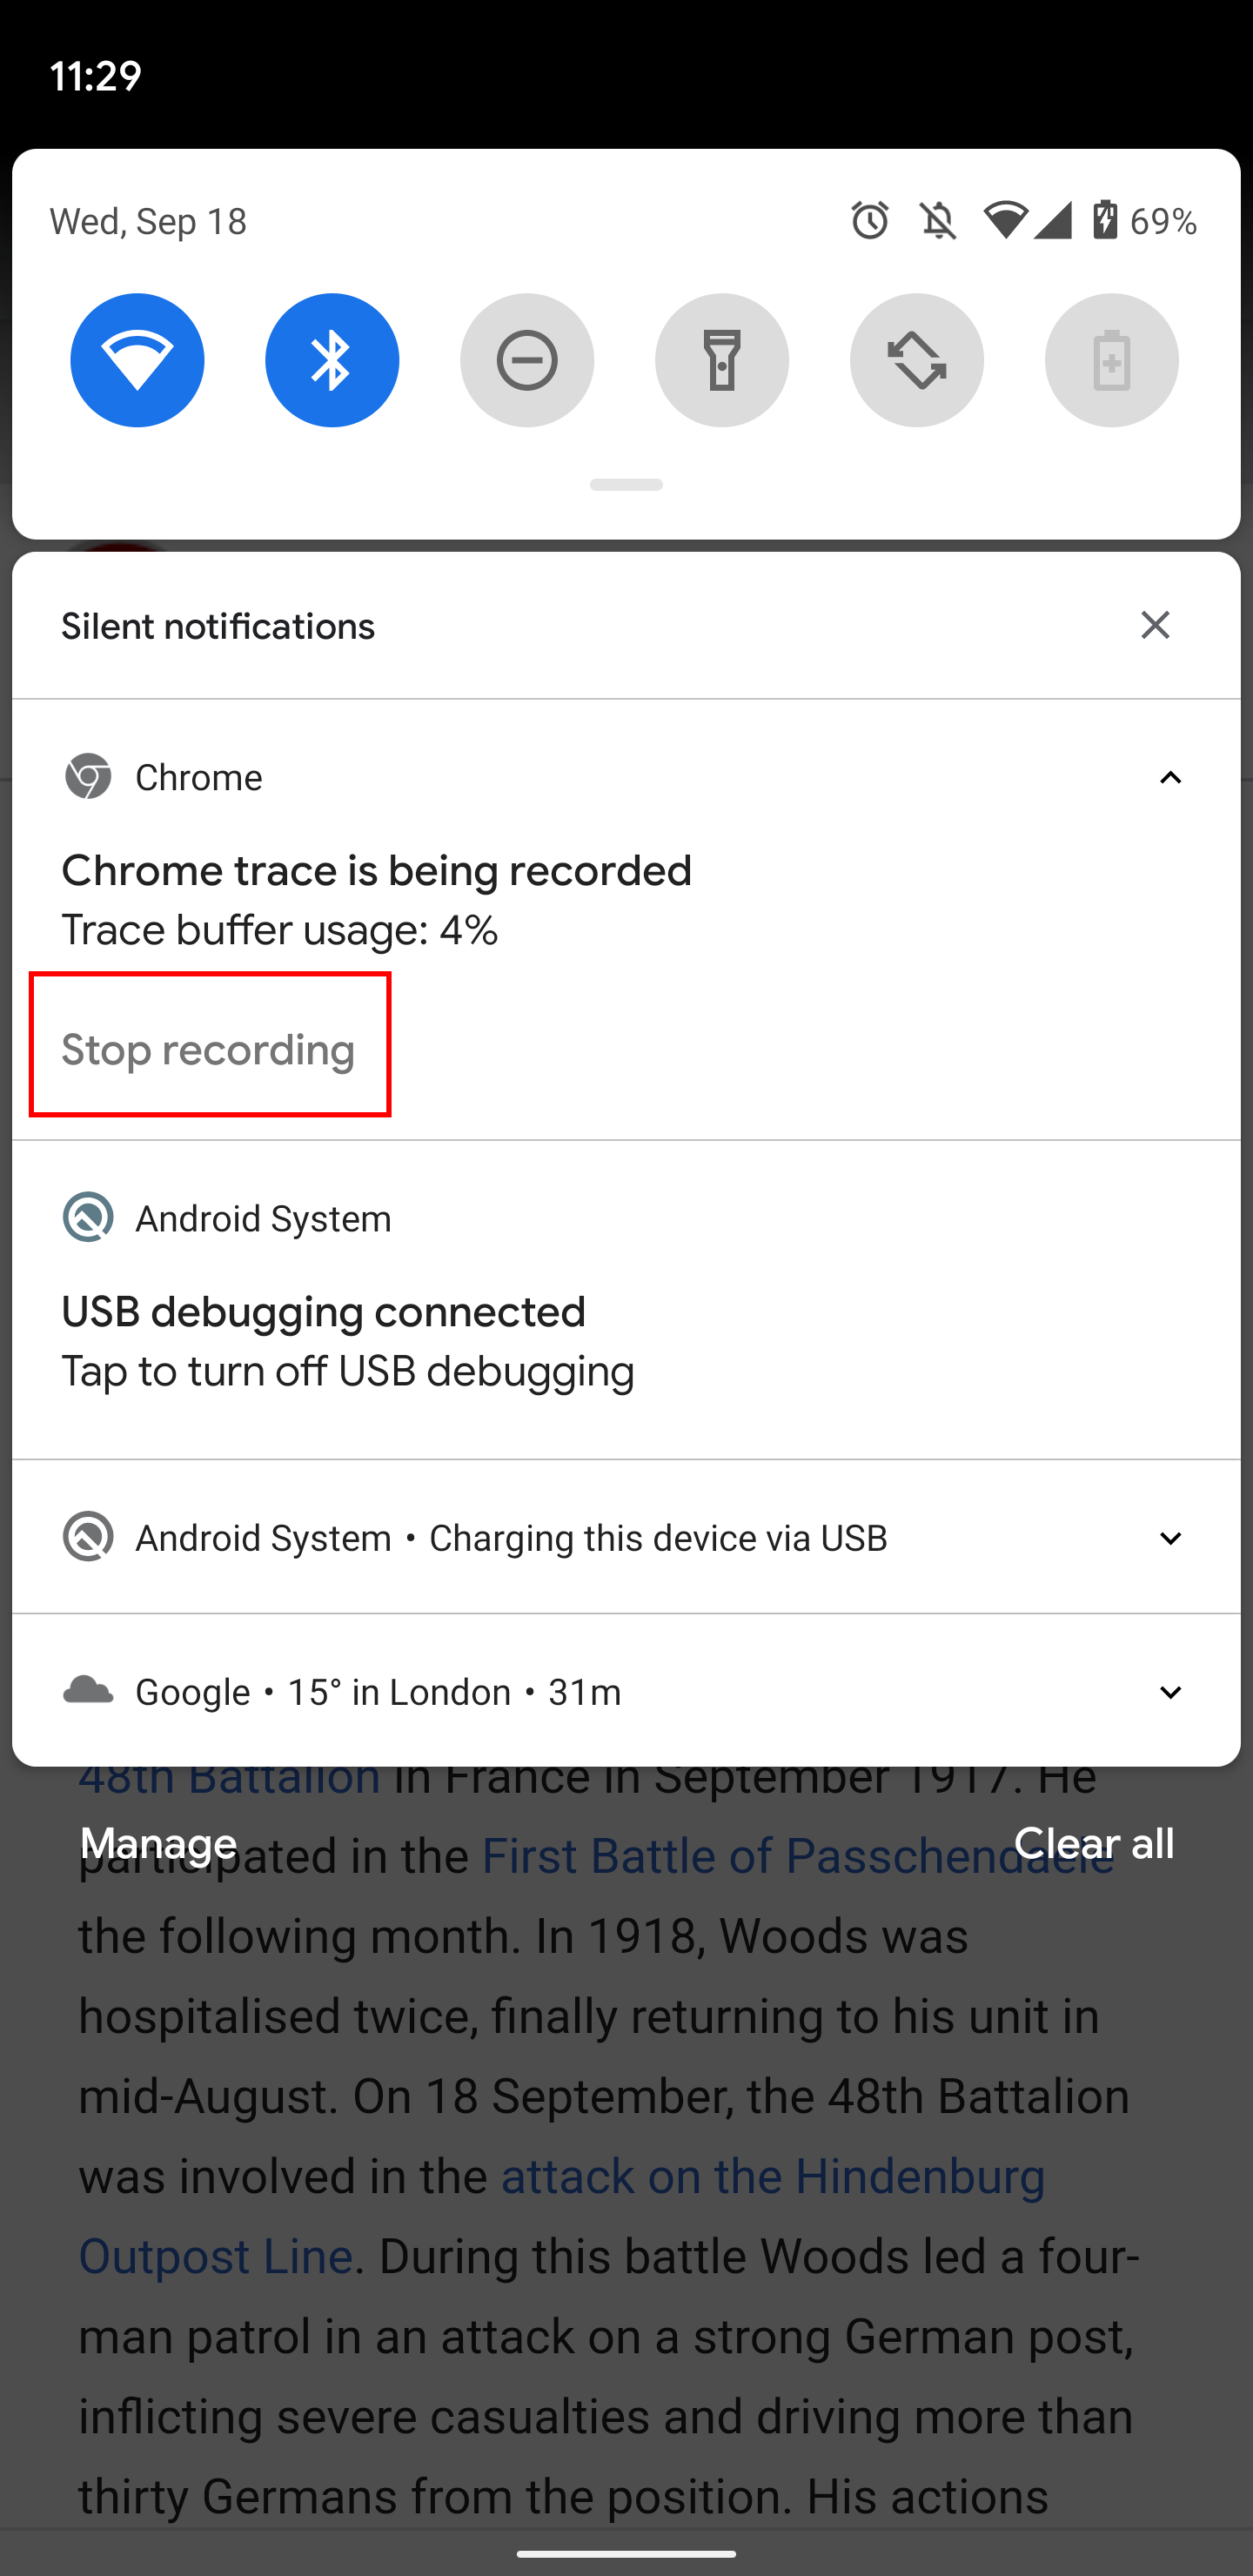
To stop the recording, pull down on the notification shade and tap "Stop recording". After this, you can access the trace with the "Share trace" button:
Capture a trace from Chrome on Android (with DevTools)
Tip: this also works with tracing the system Android WebView.
- If you're debugging a WebView app: edit the app to call the static method
WebView.setWebContentsDebuggingEnabled(true)(API docs)
- Connect Chrome DevTools on your desktop to the Android device. Follow these instructions for Chrome or these instructions for WebView
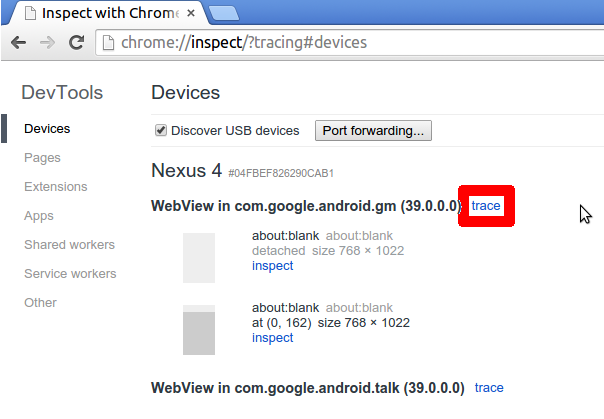
- Go to
chrome://inspect?tracingon desktop chrome. Find the app to be traced, and click on the trace link beside the title.
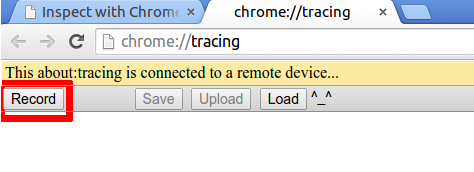
- Click on "Record" at top left.
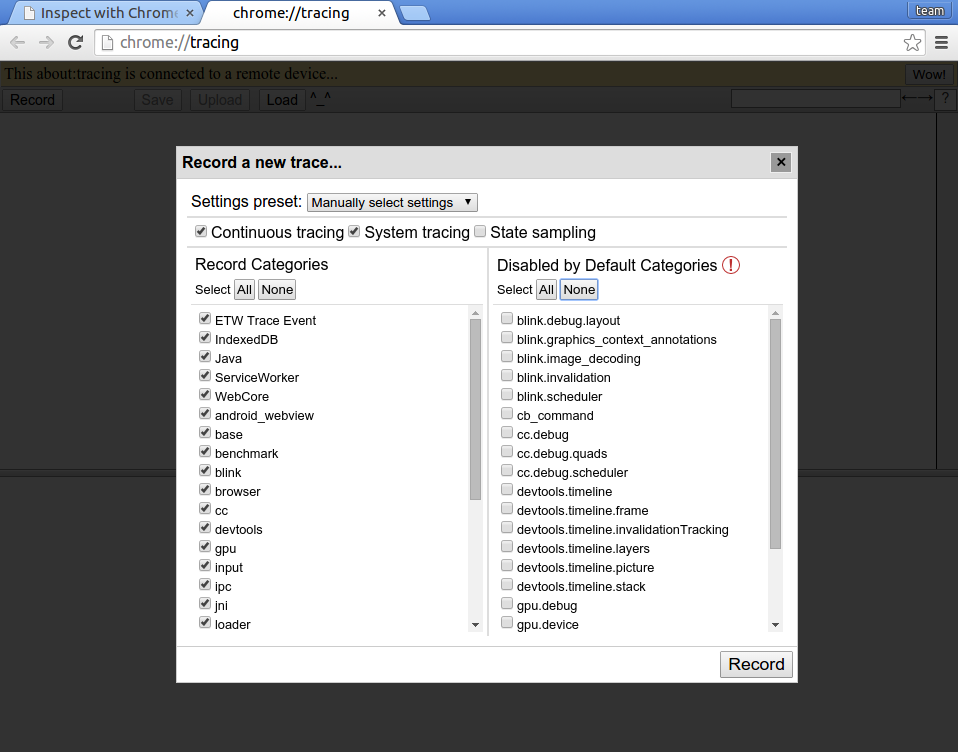
- Select trace categories. Hit Record, then Stop.
Capture a trace from Chrome on Android (on the command line)
You'll need:
- Your device running Chrome on Android
- USB debugging enabled and the device attached.
- ADB
- Linux or Mac desktop. Sorry Windows friends!
You can use `adb_profile_chrome` from the build/android/ directory in Chromium's source checkout.
Follow these steps to record a trace:
1. Launch the browser
Run Chrome normally. Developers, however, may want to launch from the command line:
$ build/android/adb_run_content_shell URL# run content shell
$ clank/bin/adb_run_chrome URL # run clank (Googlers only)
2. Optionally, make a screen recording (optional)
$ build/android/screenshot.py --video
# or
$ adb shell screenrecord /sdcard/recording.mp4 && adb pull /sdcard/recording.mp4
3. Record a trace
Look at the usage documentation for adb_trace and profile_chrome.
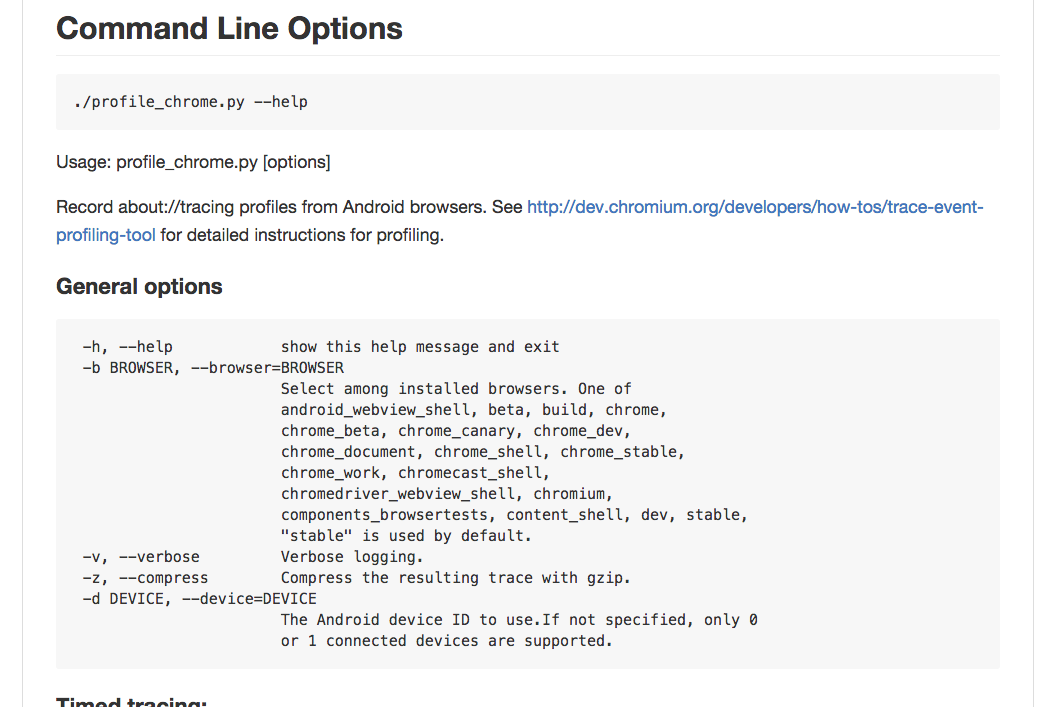
For example:
$ build/android/adb_profile_chrome --browser build --time 5 --view
Note: build here refers to the version of Chrome you are tracing. Other valid values are stable, beta (see --help for a full list).
Tracing options for Android
You can also use additional command line flags to capture more data. For example:
1. Systrace: --systrace gfx,view,input,freq,sched
Captures data about system-level events. Generally useful categories are
sched = Kernel scheduling decisions
freq = CPU core frequency scaling
gfx = SurfaceFlinger events, Vsync
view = Android Framework events
input = Framework input event processing
adb shell atrace --list_categories shows the rest.
2. IPC messages: --trace-flow
Adds arrows showing IPC message flows, making it easier to see message traffic.
- More trace categories, e.g.: --categories=disabled-by-default-cc.debug.scheduler,*
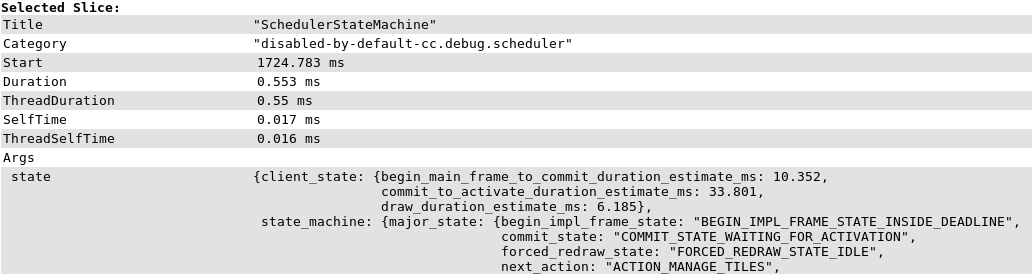
Adding more trace categories makes it possible to see events that are normally disabled. This particular example gives information about why the compositor scheduler decided to run a given action. To see the full list of categories, use --categories=list.
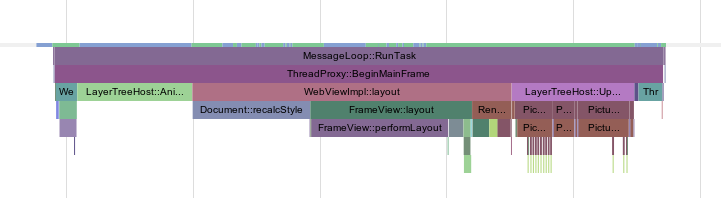
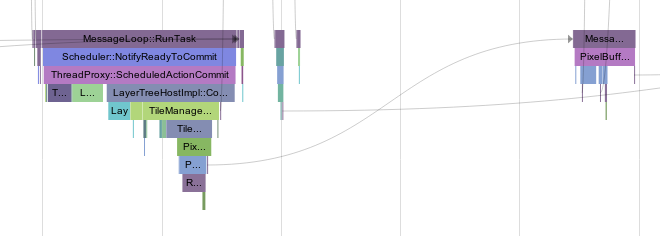
4. Frame viewer data: --trace-frame-viewer
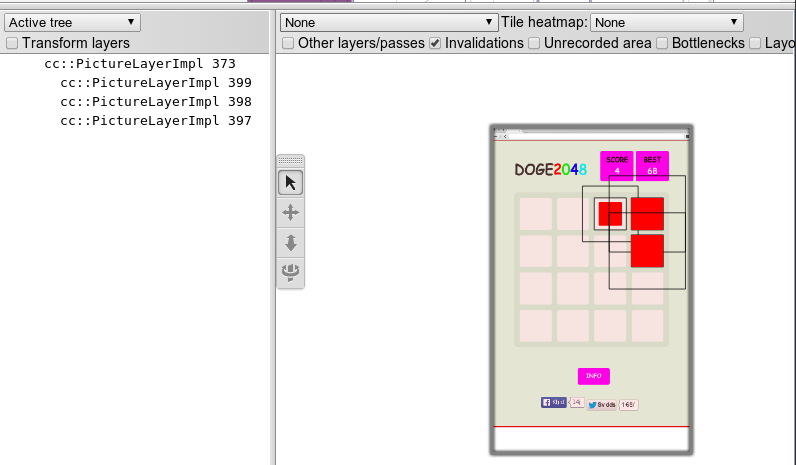
Captures rich layer data from the compositor. This is useful for understanding how the DOM affects the compositor's layer tree structure. When viewing traces like this, make sure to launch Chrome (on the desktop) with the --enable-skia-benchmarking command line flag so that all features are available.
5. Perf profiling data: --perf Perf is a sampling profiler which can help you find performance intensive parts of the source code. The --perf switch runs perf and automatically combines the data with all other enabled event sources.
You can also view the raw recorded perf data using the command line which is printed out by adb_profile_chrome.
Making a Good Recording
- Keep the recording to a max of 10 seconds
- Try to keep to 1 activity per recording. If you see two slowdowns, do one recording each. Or leave a second long pause between each.
- Pause and leave the computer completely idle for 2 seconds before and after demonstrating the slowdown. This helps make the slow part obvious in the recording.
Step by step:
- Start with only the tab you’re investigating and about:tracing open in a fresh browser session (see below for other methods of figuring out which tab is which if you need multiple).
- Set up the tab for investigation to right before the point where the problem will occur (e.g. right before an animation is going to be triggered, or right before part of the page that scrolls slowly)
- Start a tracing run in the about:tracing tab
- Switch to the tab under investigation
- Pause for a couple seconds to record empty space on the timeline (makes finding it later easier)
- Perform the action to trigger the bad performance behavior (e.g. start the animation or scroll the page). Keeping the recorded activity under 10 seconds is a good idea.
- Pause again
- Switch back to the about:tracing tab and stop the recording.
Tracing in Telemetry
For more repeatable trace recordings you may want to consider using Telemetry to automate the process. In particular the --profiler=trace, --profiler=v8 and --profiler=android-systrace flags will save a trace for each tested page.
Trace Report File Formats
After recording one can save a trace report by pressing the Save button. This will save the trace in JSON format.
It is also possible to convert it to HTML (which is easier to link to) using Catapult's trace2html script.
Slide deck of Android Tracing tricks
This information is already detailed above.