Understanding about:tracing results
Getting down with performance in web apps: not for the faint of heart.
Intro
Chrome’s DevTools are great, but sometimes you’ve got a hitchy animation or page that scrolls slowly and you just need more info on what’s going on. If you want to dig into the guts of Chrome and figure out what the browser’s really doing under the hood, about:tracing is for you. This document will walk you through about:tracing and how to use it to diagnose common, basic rendering performance problems. For background we’ll also cover a few concepts central to Chrome’s overall rendering architecture, since artifacts of this architecture show up all over tracing results.
Background: How Chrome Renders Web Pages
A key mental backflip one has to do when reading a trace is understand how web concepts are actually executed by Chrome. Once you understand how Chrome works, and its words for common web concepts, you'll feel a lot better moving around in a trace. This section covers a few key concepts to get you started.
Chrome's use of multiple processes
Full article: Chrome’s Multi-Process Architecture There are three types of processes in Chrome you need to worry about when dealing with graphics:
1. The Browser Process
The browser process is the central coordination point for all of Chrome’s renderers (i.e. things actually drawing web pages). We call the browser process CrBrowserMain, and any threads with the same PID as CrBrowserMain are threads within that process. The browser process receives input from the OS, controls the browser UI (e.g. omnibox, back buttons, the tabstrip, menus, etc). In software mode, it actually puts the image of the webpage on the screen.
2. Renderer Processes
The renderer process is responsible for a given web page. There are typically many renderer processes running in Chrome at any given time, but just one Browser process. The renderers are all instances of CrRendererMain, and threads with the same PID as a given CrRendererMain are that process’s threads. Chrome tries to put each tab in its own render process, subject to various restrictions. In general, the rule is different domains go into different processes, up to some memory-defined limit on process count. CrRendererMain is where javascript/html/css/etc is running, and in most cases, it is the bottleneck in your application!
3. The GPU Process
Chrome has a single GPU process where GPU accelerated operations are issued to the graphics driver. We call this process CrGpuMain. GPU operations are done in a separate process/thread for security and stability reasons. When you use WebGL in JavaScript, or 3D CSS, or accelerated canvas, they are being made in the renderer but then sent asynchronously for actual execution in the GPU process.
The Message Loop
All threads in Chrome use a message loop, which is roughly a bit of code that does "while(true) { pop message; run message; }". A nice feature of about:tracing is that anytime chrome is running a message, it will be traced. This means that if there is no MessageLoop task on a thread, you can have high confidence that that thread is idle.
Web page rendering/CSS/layout/reflow/etc is lazy
Positioning and rendering of renderable elements (divs, etc) is done lazily by Webkit. For instance:
- When you move a div, we just set a dirty bit and come around later and actually move it and update the screen.
- Similarly, when you change an element’s class, we don’t recalculate its new computed style until the last possible minute. We just set a dirty bit.
The actual costs of this laziness show up in the following ways:
- When javascript code asks for a computed style, or we decide it is time [here be dragons], you may see a trace for recalculateStyle. If you see that spiking, you're seeing the interaction of classnames with style cascades and your DOM size/shape. That’s WebKit inspecting your css and classnames and figuring out what things are supposed to look like.
- At the beginning of a frame [see below for definition], we recompute styles AND get ready to render. There, you will see WebViewImpl::layout, which is both style recalc and also us figuring out what part of (and how) your page should be drawn.
- Painting/Updating: when we go to make a picture of the screen, we call it painting or updating. This is picture generation, and will usually include costs like bitmap decompression (if needed), complex gradient shading, rounded edges, blurriness, text rendering, and so on.
Compositing vs Software Mode
Full article: GPU Accelerated Compositing in Chrome Chrome renders in either "software mode" or "accelerated compositing mode":
-
In software mode, Chrome software rasterizes the webpage into an image and blits it onto the screen using the underlying OS' software drawing primitives. Chrome tracks a "dirty region" on the screen to minimize the size of the blits for common operations like blinking cursors, playing videos, and scrolling.
-
In accelerated compositing mode, Chrome breaks the webpage up into layers, and then each layer is composited together using the GPU.
Additionally, accelerated mode operates in either single or multi-threaded modes:
- In single threaded mode, we periodically stop the webpage to update the screen.
- In multi-threaded (often referred to as just ‘threaded’) mode, we can update the screen without stopping the webpage, which allows us to scroll the page smoothly or run animations without hitching.
What does stopping the web page entail? In effect, the main thread in the renderer process is the thing that needs to do the screen updating. When it’s doing that, it can’t be doing any of the other things that it normally would -- like running JavaScript. Being able to run script while the screen updates is a main motivation both for threaded compositing and for web workers. The configurations to keep in mind, based on Chrome 18, are:
- Android: multi-threaded accelerated mode
- CrOS: single-threaded accelerated mode
- Desktop: depends on page content.
- When WebGL, Canvas, or 3D CSS is used, single-threaded accelerated mode.
- Otherwise, software mode is on.
We’re going to change this as time goes on: we eventually intend to enable multi-threaded accelerated mode on all platforms and pages.
Frames (as in Frames Per Second)
It’s important to understand the entire lifecycle of a frame when Chrome is drawing. The key lifecycle events are outlined for each mode below:
Software Mode
In software mode, a frame can be found by looking for DoDeferredUpdate in the trace. DoDeferredUpdate will run requestAnimationFrame, perform a layout (which is css style recalc plus preparation for rendering), and then paint the screen. We then send the bitmap to the browser where you will see an "UpdateBackingStore" which is us putting the resulting picture on the screen.
Single-threaded Accelerated Mode
In single-threaded accelerated mode, a frame can be found by looking for DoDeferredUpdate. DoDeferredUpdate does the same steps as before, but instead of sending the results as pictures to the browser, it sends GL draw calls to the CrGPuMain for every layer.
Multi-threaded Accelerated Mode
In threaded accelerated mode, you have to think of there being two types of frame: the frames generated by the renderer (i.e. what JavaScript can touch), and copies of these frames that are handed to the compositor to draw. From the renderer / JavaScript perspective, frames can be identified by the "CCThreadProxy::beginFrame" trace event, which does the usual steps of calling requestAnimationFrame, doing layout/style recalc, and painting/updating. At the end of a beginFrame, we then "commit" the world to the compositor thread. The renderer has produced a single frame. The compositor thread is then free to draw many frames based on the world it was handed. This is extremely useful because the compositor thread can render many frames e.g. in response to a scroll. Those frames will all be generated from the same “world” (i.e. page state) -- i.e. nothing will have changed from JavaScript, but the compositor thread knows how to handle certain types of other changes like input events (scrolling again) or CSS animations. So even if the renderer is choking on running all your fatty JavaScript, the compositor can continue to serenely scroll the page and run CSS animations on elements. On the compositor’s side of the world, you will see a frame as a CCThreadProxy::scheduledActionDrawAndSwap.
HTML5 Canvas
Canvas can be software-accelerated or GPU-accelerated. about:gpu will show you
which is the case for your browser / computer configuration. In non-accelerated
mode, canvas calls are executed immediately using software rasterization and are
blocking operations in the main thread of the renderer. In accelerated mode,
canvas calls are converted to GL commands and issued to the CrGpuMain process
for execution. This rendering is ‘deferred’ so the commands are issued to the
GPU process and the main thread is free to continue to run JavaScript while the
GPU process actually renders them and updates the screen.
WebGL
WebGL is always GPU accelerated. Your WebGL calls are marshalled into a command buffer and shipped to CrGpuMain where we unpack the commands and make the equivalent GL or DirectX calls. If your command buffer fills up, or you call a GL function that requires an answer from the underlying driver, e.g. glGetError or glGetUniform, you will see FlushSync call. This FlushSync blocks on the GPU process executing whatever command you issued and ruins performance.
Input
Input events are received from the system by the Browser process and then forwarded to the renderer process. When tracing an input event, first look for a (very small) ForwardInputEvent message in CrBrowserMain. This is the browser receiving the input event and forwarding it to the renderer. After the ForwardInputEvent happens, the render process will get a HandleInputEvent message. You will see events inside that HandleInputEvent if it got forwarded into JavaScript. Note that for flow control reasons, CrBrowserMain will not send more than 1 input to the renderer process at a time. Rather, it waits on sending another input until the previous one is acknowledged. The renderer will acknowledge input events immediately, most of the time. The one exception is mouse moves/scrolls -- if the screen is dirty (e.g. a DoDeferredUpdate is necessary), then the renderer will not reply to an input until the DoDeferredUpdate completes.
Javascript/V8
When JavaScript is running, you will (usually) see traces for things that begin with V8. We haven't instrumented every single thing, but you will see v8.run or v8.callfunction for common cases. See the below glossary of common trace events for additional V8 functions that are instrumented (e.g. for event listener callbacks, setTimeout/setInterval callbacks, etc). Many JS APIs interact with the browser process synchronously. E.g. cookie access, IndexedDB operations, synchronous XHR/network operations. When that happens, you can bracket the suspicious operation with console.time/timeEnd calls and look on the browser process for activity that appears correlated with your JS code. See More Investigation Strategies below for examples of how to do this.
Navigating the Tracing View
Now that you’ve got the theory down, how do you actually interact with the tracing tool? This trace assumes that you have opened up a fresh browser, and opened Wikipedia in one tab and about:tracing in another, hit record in the tracing tab and scrolled a bit in the WikiPedia tab, then stopped the recording. More detailed directions on how to do that are here.
Processes & Timelines
Once you have a trace recorded, you should get something like the following:
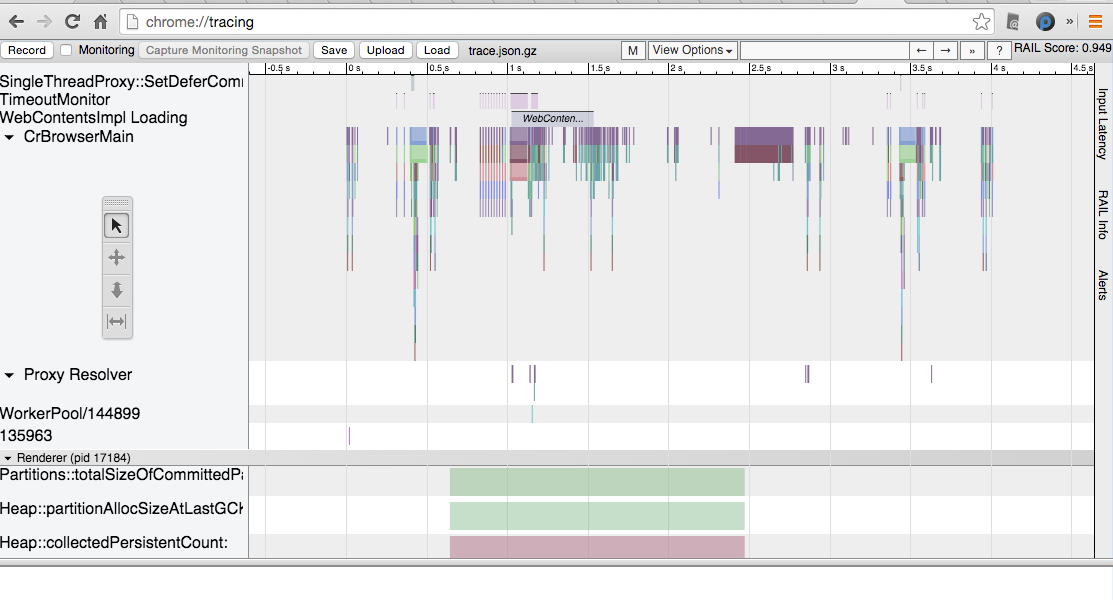
This is a visualization of the recorded trace. What you’re seeing is Chrome's multi-process architecture at work, scrolling your page. The first thing to notice is that there are three processes running: the browser (pid=17965), the renderer process for about:tracing (pid=17974) and the renderer process for Wikipedia (pid=17982). Each process has a separate horizontal track, filled with trace events. The track is basically an event timeline for events on that thread/process. Events are the colored, rectangular blocks on the timeline tracks. Time moves from left to right.
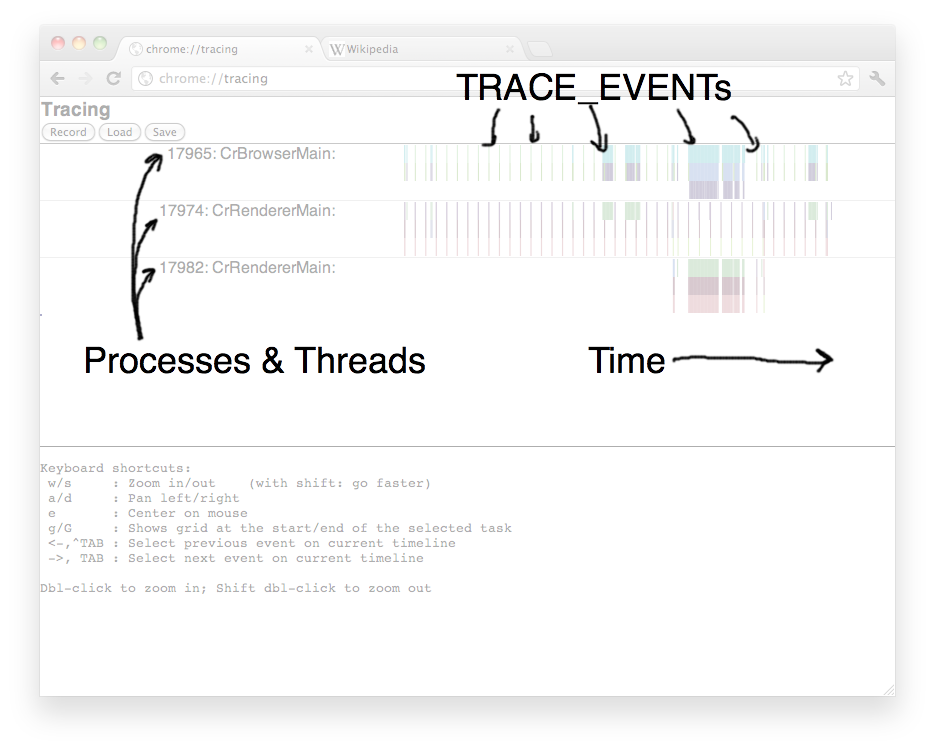
#### Trace Events
In this case, the data being shown is ~10 seconds, broken down as follows:
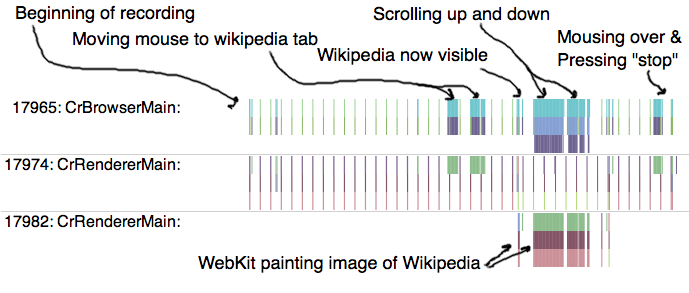
The keyboard can be used to zoom and pan around inside the timeline. The ‘w’ and ‘s’ keys zoom in centered around the mouse, and the ‘a’ and ‘d’ keys pan the timeline left and right. So, with a bit of zooming around, we can look at how a single mousewheel event propagates through Chrome:
[<img alt="image"
src="/developers/how-tos/trace-event-profiling-tool/trace-event-reading/fourth.png">](/developers/how-tos/trace-event-profiling-tool/trace-event-reading/fourth.png)
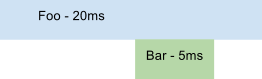
A single rectangle represents a TRACE_EVENT: where it began, and where it ended. When you see a stack of different rectangles on top of each other, it means that trace events were issued inside one another on the same thread. For example:
foo() {
sleep 10ms
bar()
sleep 5ms
}
bar() {
sleep 5ms
}
Would look like this:
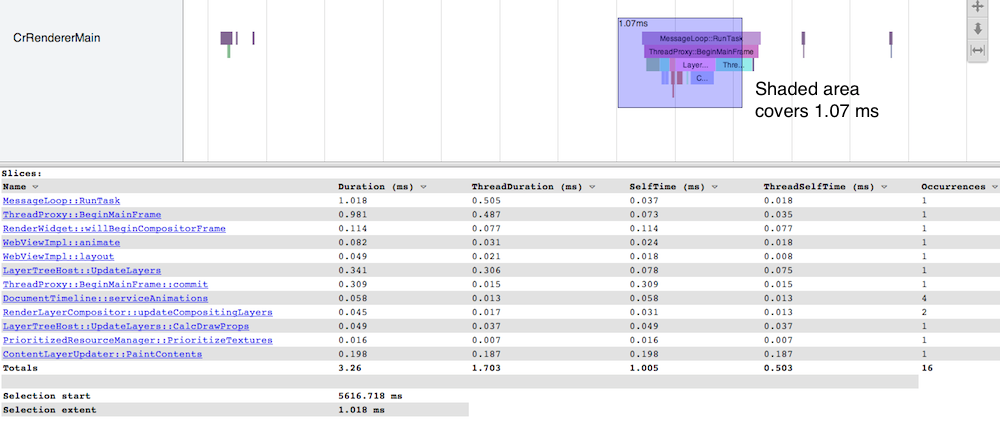
To study individual rectangles, you can click on them. This will display information about the rectangle: its Duration, ThreadDuration (CPU time), SelfTime (time spent in the current slice, subtracting the time
of all the children slices), ThreadSelfTime (CPU time spent in the current slice, subtracting the CPU time for all the children) and Occurrences (the number of times that event appeared in the selection).
The information is sortable. Clicking on a title from the info table will expand all the slices for that event. For the Foo/Bar example, the SelfTime for Foo will be 15ms (20 - 5), while the SelfTime for Bar will be 5ms (Since it has no know children).
The ThreadDuration is not available for all events and for all platforms, the SelfTime is omitted in cases where the Slice has no known children. Asynchronous events has no SelfTime by definition.
In addition to clicking, you can drag the mouse in a rectangle over a group of trace events. This will give you a list of events that intersect that rectangle and summarize them for you:
Import and Export
Once recorded, you can give a trace file to someone else. Just press the save button. The resulting file is just JSON. To load a trace, use the load button, or grab the standalone trace viewer from https://github.com/catapult-project/catapult/tree/master/tracing
Investigating Performance Problems
Now that you can navigate the basic view, let’s dive into a basic strategy for investigating a performance problem. Here’s an overview:
Setting up a good trace run
- Start with only the tab you’re investigating and about:tracing open in a fresh browser session (see below for other methods of figuring out which tab is which if you need multiple).
- Set up the tab for investigation to right before the point where the problem will occur (e.g. right before an animation is going to be triggered, or right before part of the page that scrolls slowly)
- Start a tracing run in the about:tracing tab
- Switch to the tab under investigation
- Pause for a couple seconds to record empty space on the timeline (makes finding it later easier)
- Perform the action to trigger the bad performance behavior (e.g. start the animation or scroll the page). Keeping the recorded activity under 10 seconds is a good idea.
- Pause again
- Switch back to the about:tracing tab and stop the recording.
Investigation strategy
Now let’s find a problematic frame and see what caused the hitch or slowdown. See below for more details on the trace events
- Look for the pause right before you started the problem action
- Once you’ve found the beginning of the problem area, look for
regular patterns that indicate drawing updates.
- The entire time the renderer process is busy (i.e. doing anything at all) will be marked by MessageLoop::RunTask
- A regular draw update will usually start with one of:
- an input event (RenderWidget::OnHandleInputEvent)
- a requestAnimationFrame callback (RenderWidget::AnimationCallback)
- a timer firing (ScheduledAction::Execute)
- ...and the actual drawing is done in RenderWidget::DoDeferredUpdate
- Once you’ve found the pattern indicating frame updates by looking
for a regular block of trace events and zooming in to confirm that
they’re being called from what you expect, zoom back out to look for
a problem area
- If you’re investigating a hitch, look for an interruption to the regular pattern -- a block of tracing events that takes longer than the others.
- If you’re investigating general slowness (e.g. scrolling), check to see if the entire draw block from the triggering event to the end of the deferred update are over frame budget (i.e. longer than 16ms on a 60hz screen).
- Once you’ve identified a problem frame, it’s time to figure out what
caused that frame to take too long. Options are:
- Paint time
- Look for PaintRect or CCLayerTreeHost::UpdateLayers events that take too long
- Layout
- Look for WebViewImpl::layout events that take too long
- JPEG decode/resize
- Look for ImageOperations::ResizeSubPixel or ImagerOperations::ResizeBasic
- Heavy input handling
- Look for too much activity in RenderWidget::OnHandleInputEvent
- Paint time
- An orthogonal option is that you’re GPU bound.
- If you have a ton of activity in the GPU process the card can be swamped -- in this case the renderer process might not be doing anything (won’t be in MessageLoop::RunTask) while the GPU is working feverishly. Look for lots of events in the GPU process but few in the renderer.
- Content updates as the GPU draws are under GPUScheduler::PutChanged, while the actual screen is updated (timed with a screen refresh, as Chrome vsyncs) during GLContext::SwapBuffers
Next: Fixing it!
What to do next depends on the nature of the problem. Options are:
-
Long paint times or long layout
-
Paint’s show up in the web inspector’s timeline, too, so if you determine that your problem is heavy paints you can use the inspector to figure out when these paints are happening relative to your JavaScript events.
-
You can also turn on the Chrome flag --show-paint-rects to see which areas of the screen are painted when, which can help identify what’s being painted (and from there try to reduce the amount or frequency of what’s being painted).
-
Modify your CSS styles to try to isolate and remove the problem. This is by far the highest leverage way to make a site faster! Iterate in the following loop:
- Remove one of:
- An entire element
- A single CSS style (e.g. CSS class)
- A single style modification (e.g. if you set style in JS)
- Grab another trace of the page
- Check if the paint times (PaintRect or UpdateLayers) or style
recalculation and layout (WebViewImpl::layout) times have gone
down.
- If they have, you’ve found your culprit (possibly one of many). Start adding parts of the style back in (if you removed a whole class) or experiment with an alternative way of getting the same visual effect but with different style rules.
- If they haven’t, repeat the whole process and remove more.
- Remove one of:
-
Heavy input
- You should be doing as little as possible in your input handlers. Ensure that your V8EventListener::callListenerFunction inside of RenderWidget::OnHandleInputEvent take minimal time by simply saving some state in your input handler and then actually acting on that state in your requestAnimationFrame callback, for instance.
-
JPEG decode/resize
- Unfortunately there isn’t a lot to do here at the moment. You can attempt to size your source images such that they won’t get resized, and you can attempt to invalidate them less frequently, but if necessary JPEG operations are what’s causing your woes there isn’t much you can do.
-
GPU bound
- If your page is composited and drawing to the GPU, make sure you
aren’t invalidating more layers than necessary.
- If only one thing is moving on the screen (e.g. an animation) it should be in its own layer
- If you’re scrolling and everything needs to be updated, you want to ensure that things that aren’t changing are in their own layers so they don’t get invalidated and can just be translated on the GPU
- But, if you have too many layers you’ll overwhelm the GPU -- so don’t put everything in its own layer just for the sake of it.
- In the future, we’ll have a way to see which layers are invalidated when (like --show-paint-rects but for composited mode), but it’s not finished yet.
- An easy way to force layer creation is to add a -webkit-transform:translateZ(0) to an element, which will stick it in its own layer but have no visual effect.
- An easy way to see what layers are being created for what content is to use the “show composited layer render borders” in about:flags.
- If your page is composited and drawing to the GPU, make sure you
aren’t invalidating more layers than necessary.
Tip: trace event color
Trace event types will have a common color across all runs and processes. This means that common events like MessageLoop::RunTask are always the same color, making them easy to identify.
Tip: which tab am I looking at?
It can be difficult to discern which tab is which in the renderer process. The easiest way by far to do this is just not to run any other tabs when you’re doing a tracing run. This way you’ll only end up with two renderer processes (one for about:tracing, one for your content tab) Another method is to use about:memory, which lists all tabs, apps, and background pages along with their titles and process IDs. You can figure out which process ID you’re interested in here and then refer to the renderer with that process ID in about:tracing.
Glossary: Common Trace Events
There are a few common scenarios that can cause performance to suffer that the tracing tool is good at identifying. These examples are meant to give you some guidance on common signposts to look for.
Common Events
- MessageLoop::RunTask
- This notes that the process is busy. It’s important to tell when the process is even attempting to do anything vs. not, especially when trying to track down if performance problems are in the renderer, browser, or GPU processes.
- RenderWidget::OnHandleInputEvent
- This is the browser handling an input event. Your JS event handling will also be in here as a sub-event (V8EventListener::callListenerFunction), and you can determine if that’s taking longer than it should.
- RenderWidget::DoDeferredUpdate
- This is the renderer process updating the screen.
- Note that content may not go to the screen immediately because it’s a deferred update -- textures may be passed to the GPU process and from there to an eventual screen buffer, but these various buffering layers can cause delays.
- The basic steps in a draw are:
- Animation
- Layout (see
- Painting and compositing in software, or updating and drawing on the GPU
- This is the renderer process updating the screen.
- V8EventListener::callListenerFunction
- This is V8 executing an event listener callback, probably deferring to JS code you actually wrote. It’s a good place to stick your own trace events for further detail (see below).
- WebViewImpl::layout
- This is page re-layout, which can be caused by DOM structure and style changes.
- Page layout shows up in the web inspector’s timeline, too, so if you determine your problem is layout taking too long you can use the web inspector’s timeline to track it down (i.e. making changes to your page to try to reduce the time or frequency of layout).
- PaintRect
- This is the renderer painting part of the screen that was invalidated.
- See “Fixing it” above for strategies on what to do if this is taking too long.
- ScheduledAction::Execute
- This is a setTimeout or setInterval event firing.
- Again, these show up in the web inspector so if you determine that a setTimeout event is getting in the way (blocking the renderer from drawing and causing a hitch, for instance) you can use the inspector to more easily identify and disect the related JavaScript.
- ImageOperations::ResizeBasic and ImageOperations::ResizeSubPixel
- This is an image being resized, which can be expensive.
- The best way to optimize these is probably to avoid them entirely whenever possible, e.g. by sizing your images correctly, but sometimes they’re unfortunately unavoidable.
More Investigation Strategies
Adding your own trace events
If you’re having trouble figuring out what part of your code maps to what part of the trace, it can be invaluable to add your own trace events. By doing so from JavaScript you can drop annotations onto the trace timeline, allowing easy identification of key points in your code (for instance, the beginning of a draw loop or the entrance of a particularly complicated bit of JS you fear is blowing your frame budget). Adding your own events is as simple as calling console.time() and console.timeEnd():
function Foo() {
console.time(“Foo”);
var now = Date.now();
while (Date.now() < now + 1000);
console.timeEnd("Foo");
}
See this page for more information on adding your own trace events to C++ code.
Determining which IPC message is active
To determine what IPC message corresponds with the class and line shown in the trace:
- Click on the event and note the class and line values.
- e.g.
class: 41, line: 783
- e.g.
- Open the
ipc/ipc_message_start.h
for your build.
- Protip: If it's not ToT, you can pull the git hash from about:version and replace `master` in the URL with the hash.
- Look at the IPCMessageStart enum to find your class. (If the enum
values start at line 12, you'll find your class type on line
x+12;)- e.g. class 41 maps to line
53:
ExtensionMsgStart
- e.g. class 41 maps to line
53:
- Amongst the xxx_messages.h
files,
open the one that contains your class.
- e.g. Our match is in extension_messages.h
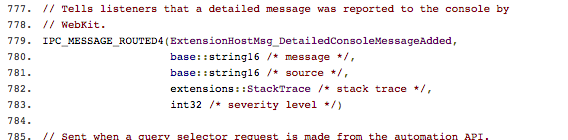
- Look at the corresponding line number in the xxx_messages.h file.
Your desired declaration will typically be ending on the given
line.
- e.g. Line 783 is the end of the
ExtensionHostMsg_DetailedConsoleMessageAddeddeclaration. We've found our message!
- e.g. Line 783 is the end of the
Staying Current
We continuously add new events and features to about:tracing to help us figure out what’s going on inside of Chrome. Some of the images above may not reflect all of these features, so don’t be surprised if there are new threads and events in your about:tracing view that aren’t listed here -- all follow the same basic pattern. We welcome additional documentation and use cases.