Profiling Blink using Flame Graphs
Quick how to explaining how to profile Blink tests on Linux and analyze the results using flame graphs.
Prerequisites
- perf - available in the package linux-tools on Ubuntu.
- FlameGraph - FlameGraph.zip or see github page.
Instructions
To get profiling data one needs to build chromium and/or content_shell with
GYP_DEFINE+="profiling=1"
The basic strategy is to do the following:
- Build with
GYP_DEFINE+="profiling=1" - Record using
perf record. - Collapse stacks using
stackcollapse-perf.pl. - Generate flame graph using
flamegraph.pl.
Profiling a Performance Test
For example, to profile and generate a visualization for the Blink
Layout/line-layout.html performance tests the following command sequence could
be used. This assumes that the FlameGraph software from above is in the PATH.
GYP_DEFINES+="profiling=1" gclient runhooks ninja -C out/Release blink_tests perf record -F 500 -g -q -- ./out/Release/content_shell \ --dump-render-tree `pwd`/third_party/WebKit/PerformanceTests/Layout/line-layout.html perf script | stackcollapse-perf.pl | flamegraph.pl > /tmp/flamegraph.svg
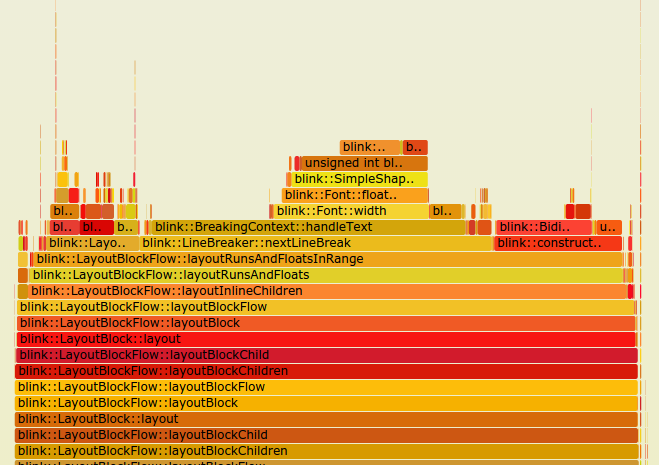
Analyzing the Results
The generated SVG file is an interactive document that can be opened in Chrome (or any other browser). Clicking a stack frame will "zoom in" to that frame. See the Flame Graphs home page for further information and other use cases.